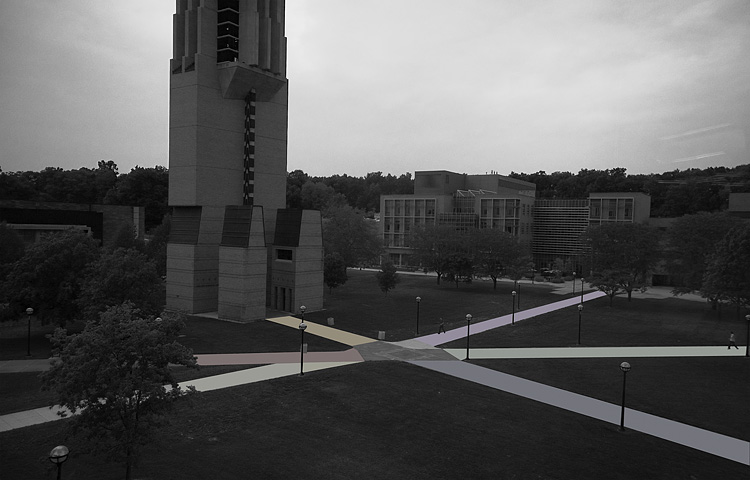
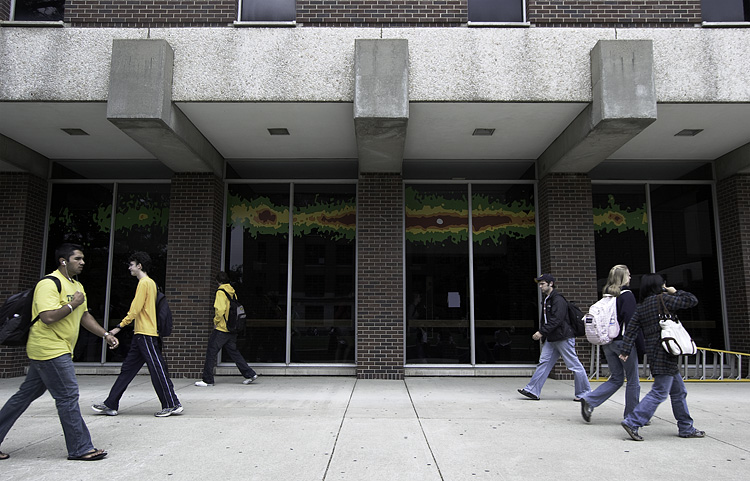
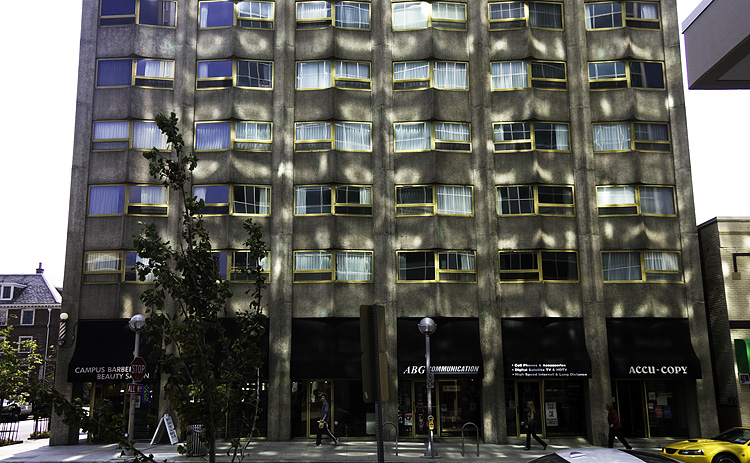
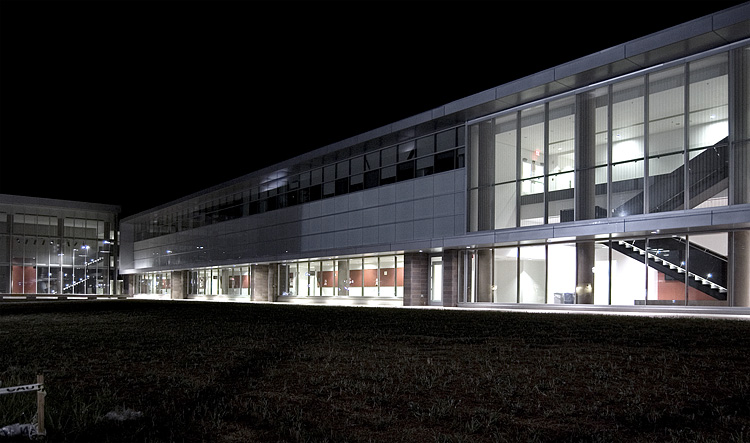
I set out to photograph the interesting art that appeared on the windows of the Dennison Science building, but ended up capturing some weird symmetry of pedestrians.
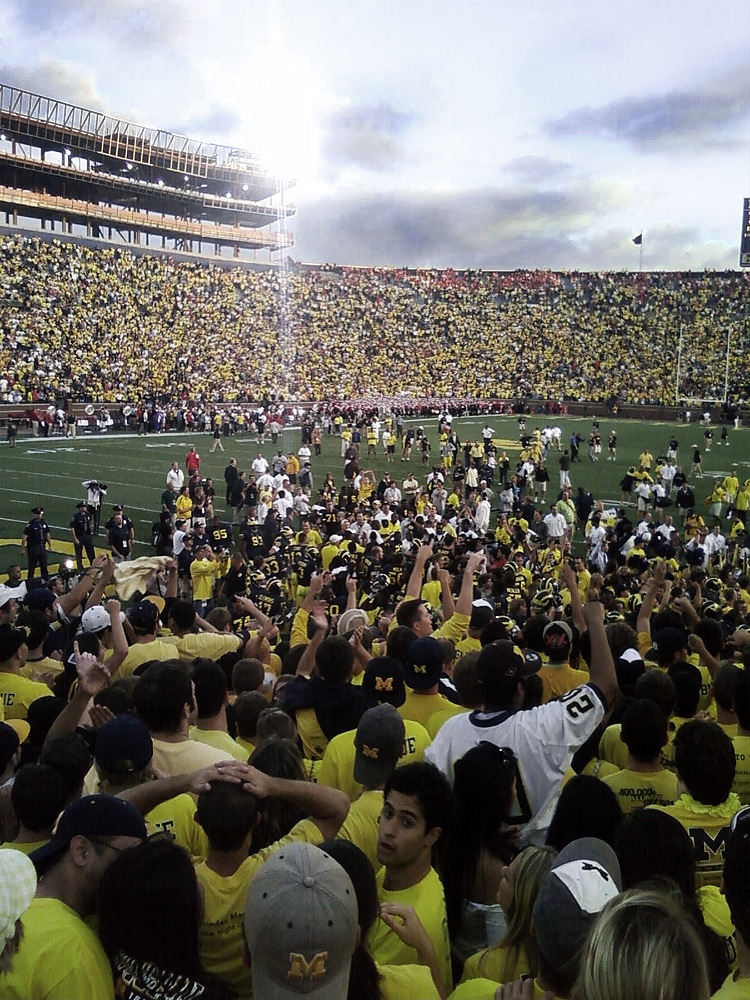
Michigan pulled up the second biggest upset in school history coming back from a 19 point deficit in basically a quarter to keep its streak of home victories against the Badgers (15 years in a row) and Big Ten opener wins (since 1967) alive. It was AWESOME. I didn't have my camera with me so i took some shots with my phone, they didn't even turn out that bad. This picture is after the game had ended when the team comes over the student section to sing Hail to the Victors. We had moved way down to get closer to the field incase we got to rush it. We didn't, but it was still sweet.
I won't even try to hide it. I have yet to find time to take my camera out and shoot since the semester started. Soon, soon, I promise. I have though come across a couple of interesting things you can look through to keep yourselves busy.
About a year ago I became interested in a field called Data Visualization. It's about as straight forward as it sounds. With so much data on so many things there is a serious need to sift through all of it. The greatest part is that the process of sorting brings together artists looking for inspiration and scientists looking for demonstration and, of course, provides the oppurtunity to be both.
One of the biggest problems with the massive data sets the human species is accumulating is that we are losing our ability to comprehend magnitudes. The sheer size of numbers prevents us from grasping their meanings. 24-hour news sites broadcast facts and figures from study after study, throwing numbers all over the place, but do you really have a concept of how big one million actually is? As a physics major, I deal with extreme orders of magnitude every day and I have no idea how small a billionth of an inch is, let alone quantum effects on the order of 10^-34. Thats 34 0's:
.00000000000000000000000000000000001
That doesn't mean anything to anybody.
This is a problem because it means people can stand up and shoot off figures knowing that they won't be challenged because no one knows what they mean to begin with. The most annoying example that comes to mind is something you are hearing more and more often. Carbon emissions. Now, I want to be clear, I believe in global warming, I believe in climate change, I believe humans are LARGELY to blame, but what I don't understand, are their numbers. A standard quote goes something like this, "Leaving your cell phone charger in releases 100 tons of C02 into the atmosphere!" 100 tons! Thats like 50 cars! That makes no sense at all, what kind of volume does that 100 tons take up? Now, I realize here that I am making myself look like an idiot because thats clearly not what 100 tons of C02 really is, but the point is if I don't know, I guarantee a lot of people don't know. People have no concept of what these numbers even mean.
But this post isn't about being cynical or angry at people, I am just trying to motivate the need for work in data visualization. When you hear statistics like "Americans use 'insert large number' cans per year." You should think, "Well how many is 'insert large number' cans? Thankfully, Chris Jordan will help you:
This is two million bottles (2,000,000) the number of bottles used in the US every five minutes...a lot...but you can see it.
I strongly encourage you to check out more of Chris Jordan's work to help give meaning to these statistics: http://www.chrisjordan.com/
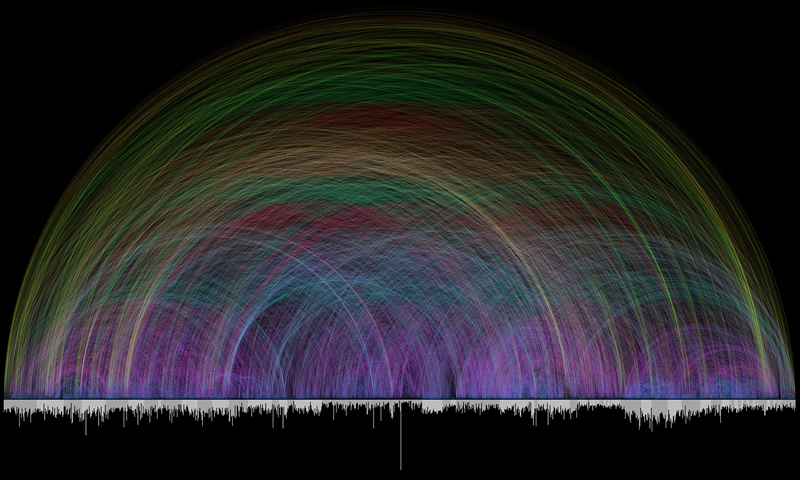
So coming up with good ways to represent data is a good thing, but data visualization is also about making relationships come to the surface. Relationships that would not have been visible before. Chris Harrison (note, all good data visualizers are not named chris), a PhD student at Carnegie Mellon has produced some of the most amazing data visualizations I have ever seen. Perhaps the most striking is work he did exploring relationships in the Bible.
The bar graph that runs along the bottom represents all of the chapters in the Bible. Books alternate in color between white and light gray. The length of each bar denotes the number of verses in the chapter. Each of the 63,779 cross references found in the Bible is depicted by a single arc - the color corresponds to the distance between the two chapters, creating a rainbow-like effect.
You can see the enormous power of data visualization to give insight into relationships that could not be found by simple eyeballing these huge data sets. The most amazing this is that these relationships are as wonderful because of their meaning as they are for the inherent beauty they display. All of these unbelievable symmetries and details are sitting right there if you know how to highlight them.
For lack of time, i'll turn to a final example of a data visualization technique that resonates (no pun intended...ok maybe a little) with me. I have a foundness for music and just about anything audio. Being an auditory learner and the type of person who always has headphones on, playing a soundtrack to my life, it is no surprise to be attracted to any new way of expressing music or sound. To be clear that this is relavent, sound is just data. Sparing you from the gory details, sound is just pressure waves in the air which hit something called a microphone. The microphone takes these pressure waves and converts them into electrical signals that a computer can process. Speakers then, act as reverse microphones, taking the audio data and vibrating to repoduce the pressure wave.
So wouldn't it be cool if you could take that data and do something else with it? Well people have. The best example I have is something I just stumbled across about a week ago and was awe-struck. A graphic designer named Robert Hodgin made this:
Again, I will spare you the details, but basically you write computer code which analyses the sound data and they serves are sort of a conductor for the program to create visuals. The most amazing thing about this video is that it is NOT NOT NOT animation. What you are seeing is a computer programming that is reacting ONLY to the audio. Another way to think about it is having a physical system with lots of particles floating around. Those particles travel on trajectories based on some fundemental laws and initial conditions (how hard to kick them). The program is the laws, and you use the music itself to provide the initial conditions. It is a way of allowing inherent qualities of the music to drive creativity in an entirely different medium. In this case, sound is creating sight.
This is Robert Hodgin's blog, which gets into a bit more about the creative process behind this. Incidently, he is the creator of the new iTunes Visualizer (open the newest version of iTunes, play a song, go View - Show Visualizer).
For more cool stuff like this, check out this site, which uses similar principles to explore the phenomena of Synesthesia. For those curisious, synesthesia, is a condition where the auditory nerve is connected to the optical nerve in such a way that people actually see things like colors or shapes when they hear music. As another tangent, the Nobel Prize winning physicist, Richard Feynman, said that he had some form of this, but with solving equations, as if he could analysis equations by seeing different parts as different colors.
Well that took probably as long to write as it would have to go take some more pictures, but I hope you found it interesting. If you find any spelling or grammatical errors, sorry but I don't care, I think you get what I am writing about.
I leave you with a more humorous, but none the less insightful data visualization:
It never ends. For those looking for a blog devoted entirely to this sort of stuff, check out: http://infosthetics.com/
**EDIT** Gah i keep forgetting really great things. I came across this blog today which i found hilarious, and is a great example of how powerful simplicity can be. I will add the link to my blog list at the bottom of this page. http://indexed.blogspot.com
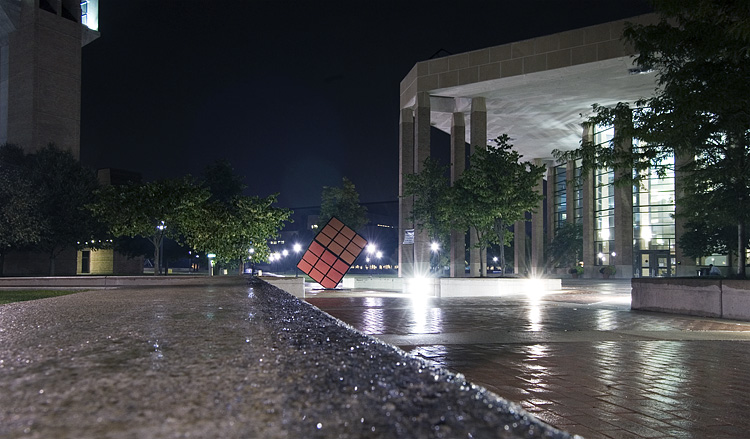
There are two large metal cubes on campus. One of them in front of the administration building on central campus, the other, featured above, sits in the center of north campus. As north campus is home the College of Engineering, it is fitting that their cube is the solved Rubik's cube.
I know I already posted a picture for today and that this blog is primarily for photos, but I really can't help myself. Its the end of the world as we know it...
I am not talking about the possible (probable?) election of the McCain Palin ticket or some new mutation of avian flu, I am literally talking about the end of the world.
Tonight/Tomorrow, at 1:30 AM EST (thats the morning in Geneva, Switzerland), the Large Hadron Collider (LHC), as massive physics experiment built at CERN, will be switched on for the first time. Before I talk about the LHC I also want to mention a few really cool things about CERN. Besides doing lots of physics experiments, they also invented the internet.
Back in my senior year in high school, while making my college visits, I met with Dr. Keith Riles (incidentally I have him as a physics professor this semester) and he told me the story of who really invented the internet. Sorry, it wasn't Al Gore. In 1989, the people at CERN were trying to figure out how to send data out to universities for analysis. This was basically a side project that people worked on after they went home from work. A guy named Tim Berners-Lee came up with a solution that is now known as the Hypertext Transfer Protocol (hence the "http" before the website address). To promote his idea, he simply placed a computer on a desk outside his office with a sign that read, "Word Wide Web. Try it!"
I bring this up because CERN has re-invented the internet in preparation for the LHC. There will be SO much data generated by the experiment that an entirely new web needed to be created. This new technology has been named "The Grid" and will be 10,000 times faster than the best connection you can get from your cable provider. Of course, for the near future this tech will be reserved for huge installations and the academic community because it so complicated, expensive, and you don't really need it, but Its still really cool.
Ok, back to the LHC. The first task will be circulating a beam of protons around the 17 mile underground loop. Later, a second beam will be circulated in the opposite direction and after some highly precise alignment...BANG!
The basic idea is this: Make two things go really really fast, smash them together, watch what happens to all the debris, repeat. Now of course its infinitely more complicated than that, hinted to by the $10 billion dollar price tag, but this kind of thing has been done before, just with less energy and on a smaller scale.
The main thrust of this experiment is to simulate the conditions of the universe less than a millionth of a second after the big bang. Hopefully, a new particle will pop out. One of the most desired particles, the Higgs-Boson, is for now just a theoretical construct that answers a fairly important question of why things have mass. If its found, well knowing why we have mass is kind of a big deal.
Now getting back to the important stuff like...the end of the world. Members of the Flat Earth Society (not really) and other uneducated knit-wits with the help of literally 2 or 3 crackpot physicists (did I mention CERN has thousands of scientists from all over the world working on this project so 2 or 3 is meaningless) continue to insist that this experiment is going to create a black hole that gobbles up Earth and must be stopped at all costs.
Thats right. Giant, freedom hating, blasphemous, black holes, and they're out to destroy YOUR life because they hate YOU!
So a couple of things. Black holes? Yes, its true. Theoretically, black holes could be created by this experiment. Actually, it would be REALLY REALLY COOL if they were. Here is the caveat: they will be so tiny that they could NEVER...EVER...do anything to harm anyone. Period. End of story. No matter what Sarah Palin or Jesus tells you. So get over it and let smart people do great things.
And if the world really does end tomorrow, I will find that hilarious.
This is one of the ATLAS detectors that will look at the debris from the collisions. This thing is HUGE and was actually built at University of Michigan (and other places but who cares).
Just to give you a sense of how big these things actually are.
According to wikipedia, this is data taken from smashing two gold atoms into each other. Each streak represents a particle that flew out of the collision
**EDIT** I apologize that was such a random post, I wrote it in my 3 minute breaks between classes, I will clean it up a bit later if I get time.
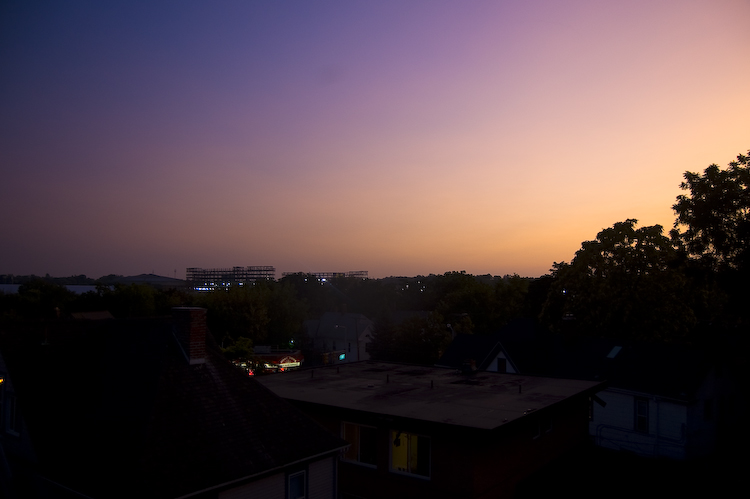
A time lapse taken from a window of my house over-looking State St.
Every saturday 110,000 people flock to Michigan Stadium (The Big House) to cheer on the Michigan Wolverines. Most of them walk by my house.
To make this video, I had my MacBook Pro instruct my Nikon D40 to snap a picture every 2 seconds for about an hour and a half. There are 1900 pictures in total, which were batch processed with photoshop. I then used Quicktime's Time Lapse tool to sequence the pictures into a movie. I added titles and a soundtrack with iMovie HD.
A note about the music. The track is from the Philip Glass' score to Godfrey Reggio's masterpiece of a film, "Koyaanisqatsi". I highly recommend people look into both Glass' and Reggio's work.


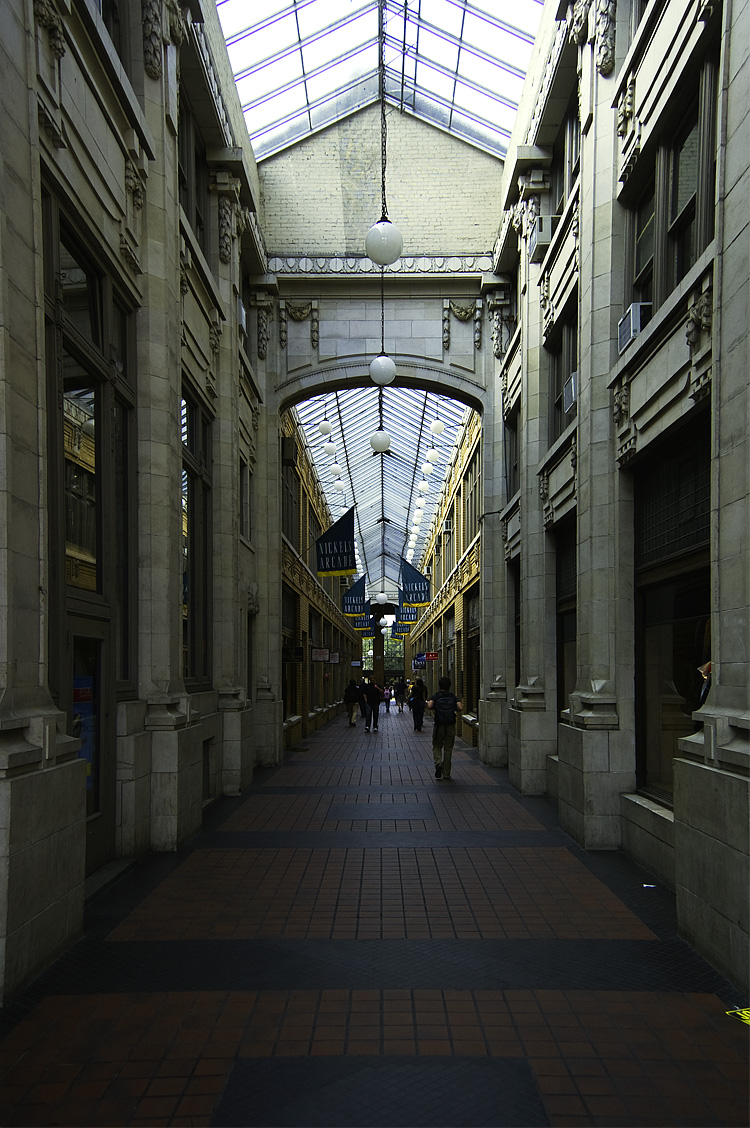


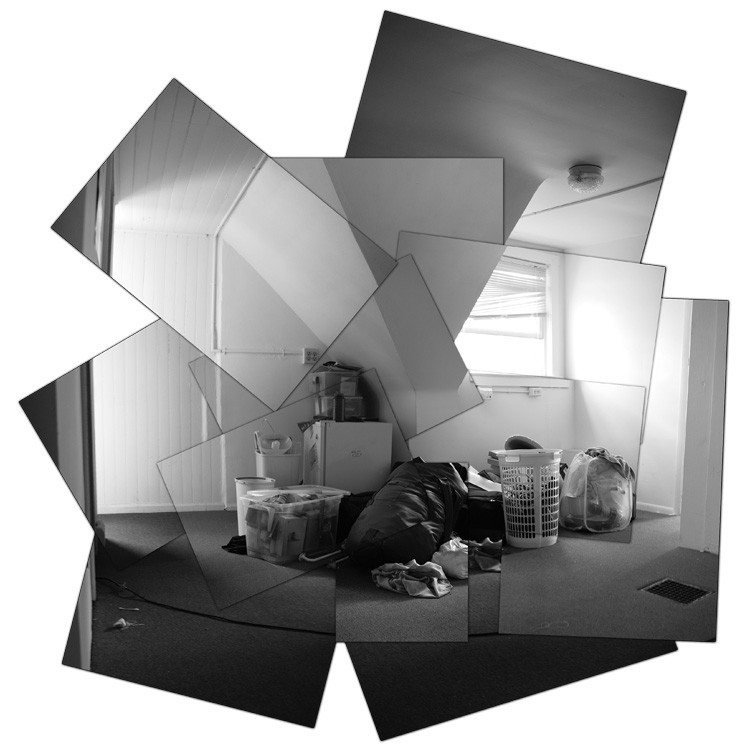
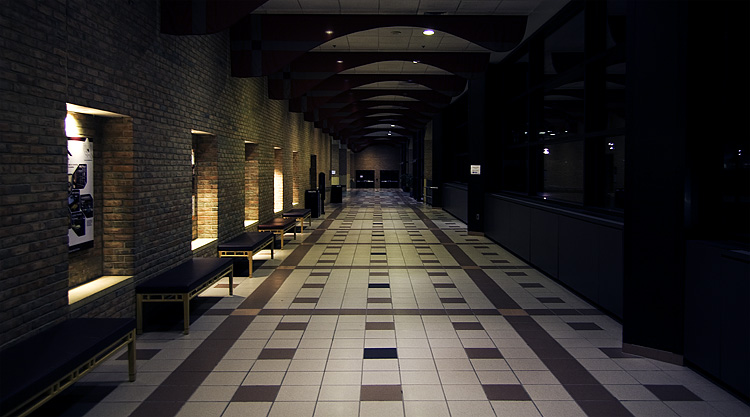 An interestingly lit hallway.